
Equity markets have sold off and remain on edge. What was already a climate of heightened uncertainty has been pushed to a breaking point by US President Trump’s sweeping tariff announcements – triggering a sharp spike in volatility amidst deepening concerns about a broader economic fallout (see exhibit 1). Retaliatory measures from major economies are just beginning as all countries process a world with heavily curtailed US demand, leaving interconnected markets struggling to regain footing. The environment has shifted from uncertain to outright unstable.
While the geopolitical outlook and resulting macroeconomic fallout looks impossible to divine, what is certain is that the basic principles of investing remain more resonant and relevant today in this environment of radical uncertainty, where the “unknown and unknowable” prevail.[1] In this paper, we want to consolidate and reiterate three core investment principles to keep top of mind in navigating the tumult; these form the cornerstone for a disciplined, risk-aware approach.
Exhibit 1: VIX index (monthly, Jan 1990 - 5 April 2025)
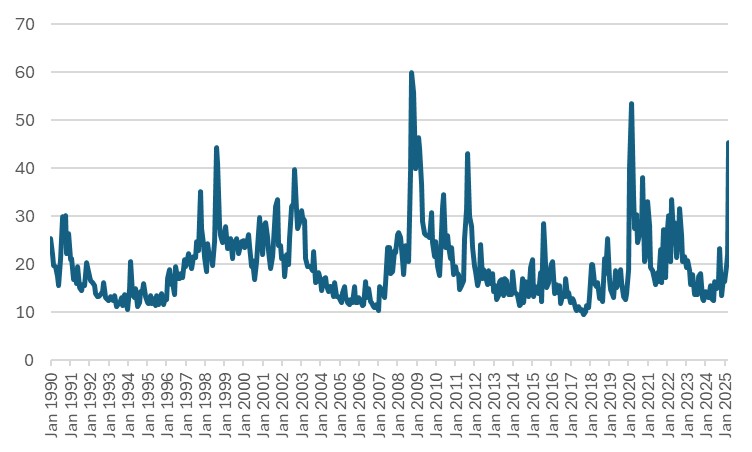
Note: The CBOE Volatility Index (VIX), also known as the Fear Index, measures expected market volatility using a portfolio of options on the S&P 500 Index.
Source: Bloomberg.
Principle #1- Keep a long-term mindset
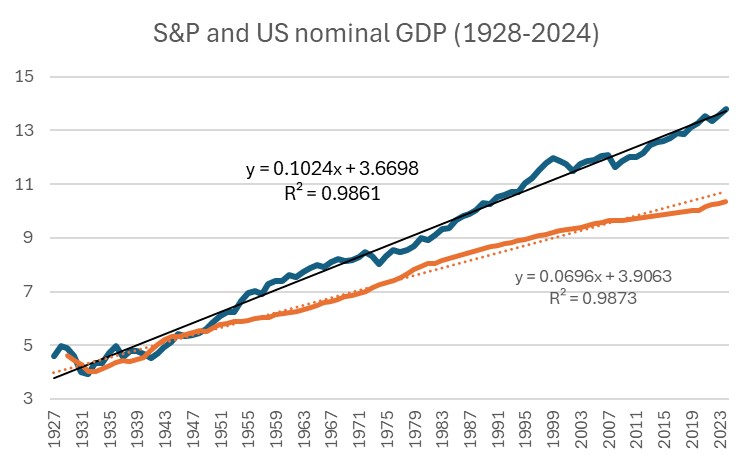
This may be easier said than done, and can be a very demanding ask, particularly given recent sharp declines in risk assets. But predicting with conviction the market’s direction over the next days, weeks and months – given unknowable US-driven policy shocks and potential for bilateral trade retaliation that can weigh on market performance, vs policy rollbacks that can lead to a sharp bounce – is a fool’s errand. Remember instead that equity investing is a long game, based on a claim on future growth, anchored on secular trends that are very hard to dislodge: e.g., demographics, technological advancements, capital investment. The following chart illustrates the positive upward trend on the S&P 500 Index and the US nominal GDP over a century, which shows the average S&P 500 Index total returns of over 10%, (blue line) outpacing average nominal GDP growth of 7% (orange line).
Exhibit 2: S&P 500 Total Returns Index and US nominal GDP (in natural logs, annual observations, 1928-2024)
Source: Damodaran, Bloomberg, Bank of Singapore.
While there has indeed been precedent for protracted absolute declines for the market and contraction in nominal economic activity (arising from negative real GDP growth combined with deflation), this is a true black swan event having occurred only once in the last century, during the Great Depression in the early 1930s. Exhibit 3 shows that the years between 1930-1932 were characterized by real economic contraction and deflation (bottom left quadrant of the chart) and some of the steepest and continuous annual declines in the US stock market on record.
Exhibit 3: US real GDP growth (x-axis) and inflation (y-axis), and coincident S&P 500 Total Returns Index (only negative returns are shown, and illustrated by bubble size) (1928-2024)
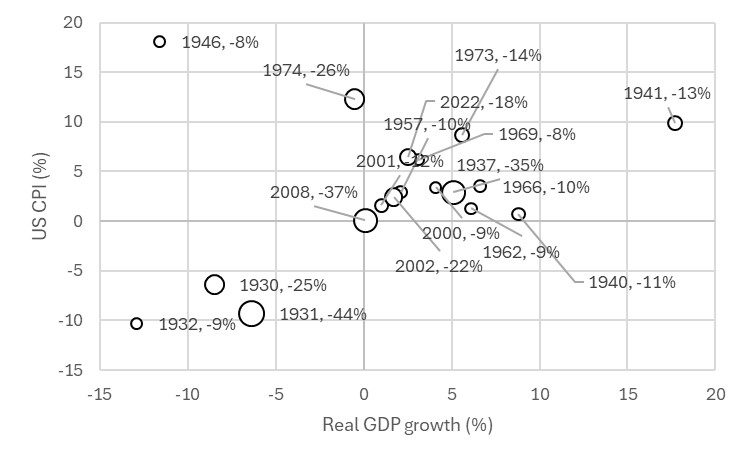
Note: Years and US equity returns are labelled;
Source: Damodaran, Bloomberg, Bank of Singapore.
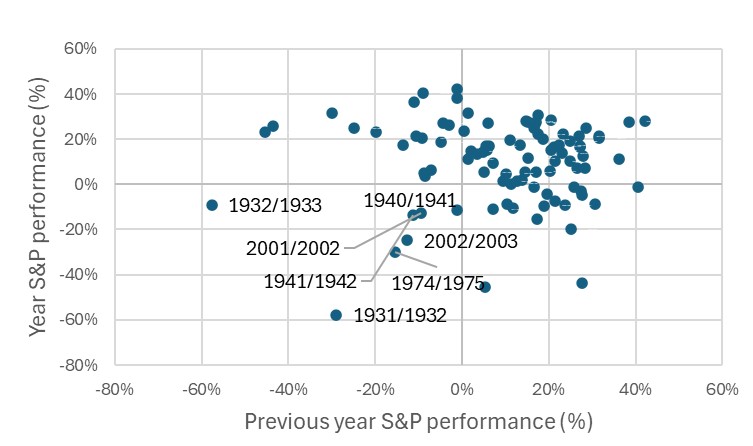
Moreover, recall that market timing is near impossible to execute, and the costs of bad timing can be significant. The best and worst years are frequently close together: historically, the stock market’s biggest upswings often happen immediately after its biggest downswings (this is 70% of the sample of down years, and is shown in the top left quadrant of exhibit 4). Two years of consecutive negative returns occur with less frequency (30% of the time) and tend to be associated with seismic economic shocks: depression and deflation (early 1930s), stagflation (1970s), World War II (early 1940s). Are we irreversibly headed in this direction? While the odds of a stagflationary outcome have risen, it’s impossible to tell at this juncture, given the absence of a clear US trade policy direction, no line of sight on how the trade war can play out, balanced by a considerable arsenal of countercyclical liquidity measures at the US Federal Reserve’s disposal.
Exhibit 4: S&P 500 Index annual total returns versus previous annual returns (1928-2024)
Source: Bloomberg, Bank of Singapore.
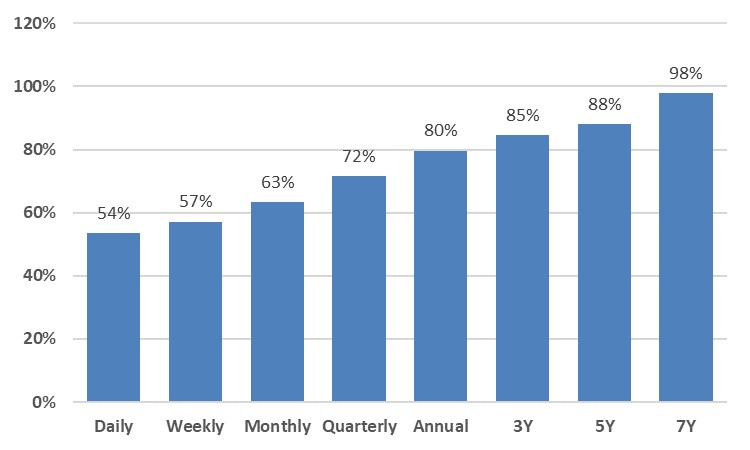
Hence, intentionally pivoting the focus from daily, weekly or monthly returns to a longer time horizon, measured in years, shifts the perspective from this short-term cacophony to long-term growth.
Exhibit 5 shows the share of positive returns in the S&P 500 Index using different frequencies (i.e., returns computed over daily, monthly, quarterly, annual and multi-year horizons). The mindset, focused on multi-year performance to capture the return potential arising from secular forces, stands a greater chance at positive performance than the short-term mindset intent on timing the market.
Exhibit 5: Share of positive total returns in the S&P 500 Index over 1970-2024 using returns computed over different frequencies
Source: Bloomberg, Bank of Singapore.
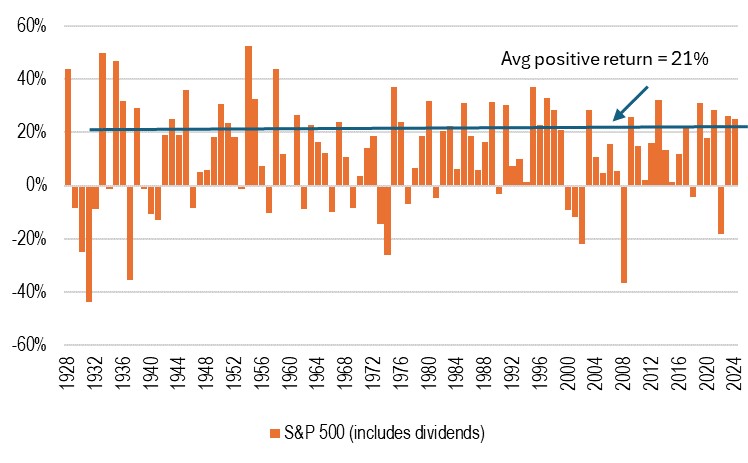
Fear and panic can drive impulsive and sub-optimal decisions, such as selling at the bottom, forgoing the recovery phase, wherein historically in the case of the S&P 500 Index, most above-average positive returns are concentrated (see Exhibit 6). Having a pre-defined risk management strategy – which we elaborate on later – and staying focused on the fundamentals that underlie investment valuations can help investors stay disciplined.
Exhibit 6: S&P 500 Index annual returns (1928-2024)
Source: Damodaran, Bank of Singapore.
Principle #2 - Manage drawdowns with bonds
Eras of radical uncertainty, alongside healthy yields, are when bonds thrive. Deep uncertainty, and a build-up of “unknown and unknowable” considerations, can nudge equity market dynamics closer to extreme scenarios. Investors need to be more proactive than ever in insulating their portfolios from drawdown risk. Allocating a portion of investments to lower-risk assets like bonds can help cushion losses during broad risk-off episodes. This strategy ensures that when riskier assets experience drawdowns, more stable investments provide balance and limit overall losses.
Already, through 1Q25, while the S&P 500 Index has posted a -15% price return, US Treasuries (UST) have returned 4%. Adjusted for relative volatility, the move in bonds is meaningful and reflects the jump in demand for its defensive properties.
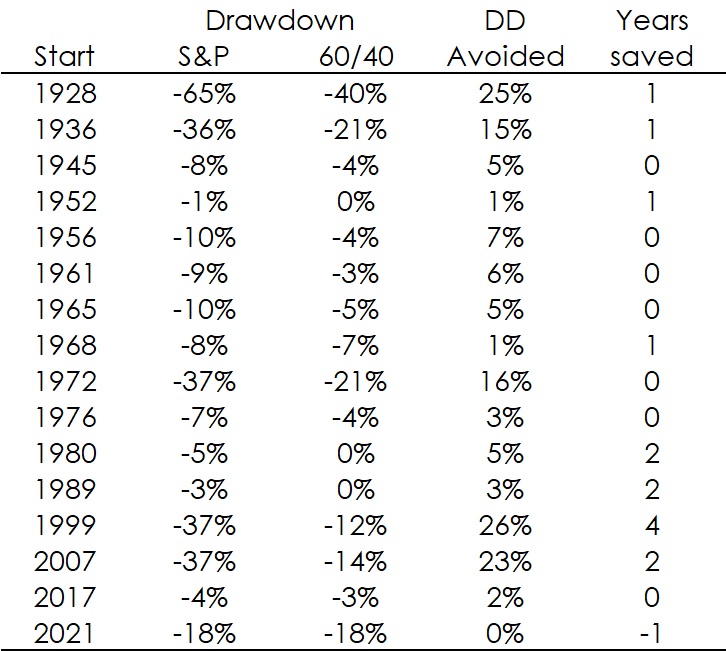
Exhibit 7: S&P 500 Index vs a portfolio of 60% S&P 500 + 40% UST drawdowns, comparing the drawdown and time averted (1928-2024)
Source: Damodaran, Bank of Singapore.
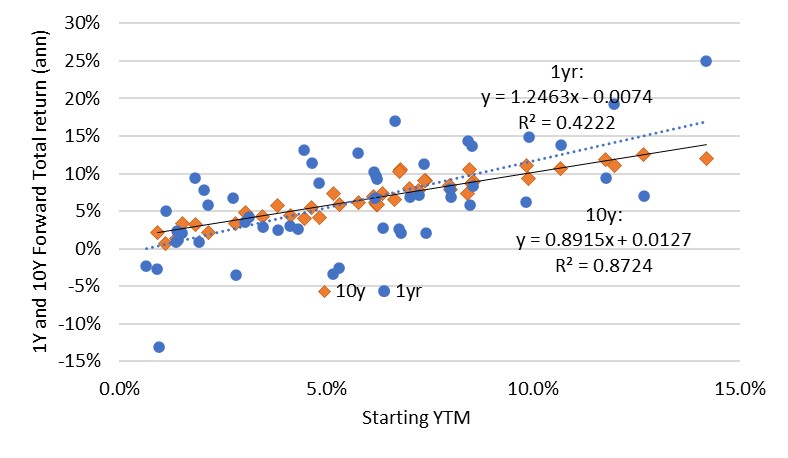
Exhibit 8: YTM and subsequent UST Index total returns over 1 and 10 years (annual data, 1973-2024)
Source: Bloomberg, Bank of Singapore.
Across time, there are multiple episodes when bonds have contributed to cushioning the impact of equity drawdowns. Exhibit 7 summarises the drawdowns from 100% invested in the S&P vs a balanced portfolio of 60% in stocks and 40% in bonds. The penultimate and final columns show the drawdown averted in terms of performance and years saved. For example, a 60-40 portfolio in 1999 would have drawndown 12% vs 37% for a 100% allocation in US equities, hence trimming the cumulative loss by 26ppts, and saving 4 years of time spent in drawdown and recovery.
Moreover, in environments of extreme uncertainty, leaning on the ability to estimate bond returns with available starting bond yields, rather than the use of scenarios and forecasts, should provide some welcome reliability to the prospective returns of the portfolio (see exhibit 8).
Principle #3 – Diversify across asset classes, regions, styles and factors to manage risk
As we have written across all our primers, a portfolio approach to investing is widely regarded as superior to a concentrated exposure for sustained investment performance, because it leverages diversification to manage risk and improve long-term returns. Diversifying across asset classes generates more consistent investment performance across economic regimes, reducing the risks associated with investment decisions based on unpredictable macroeconomic outcomes. By spreading investments across a variety of assets, sectors, or geographic regions (and hence currencies), investors reduce the likelihood of significant losses tied to the underperformance of any single investment.
A parsimonious set of distinct return drivers and risk factors influence asset classes in different ways, so the combination results in a diversified portfolio. The following table summarises some of the major asset classes, and their key return drivers (exposures) alongside factors that can be a headwind to performance (risk).
For example, equities generally provide returns through dividends and capital appreciation (via multiples expansion, profit margin and revenue growth), levered to actual and expected economic growth, alongside improvements in operating efficiency, market expansion and competitiveness. However, they also carry a higher risk due to market volatility and company-specific factors.
Bonds, on the other hand, typically offer stable income through interest payments and are influenced by interest rate changes and credit risk, often serving as a safe haven asset during market downturns.
Exhibit 9: Key return drivers and risk across asset classes (macro factors highlighted in red and green)
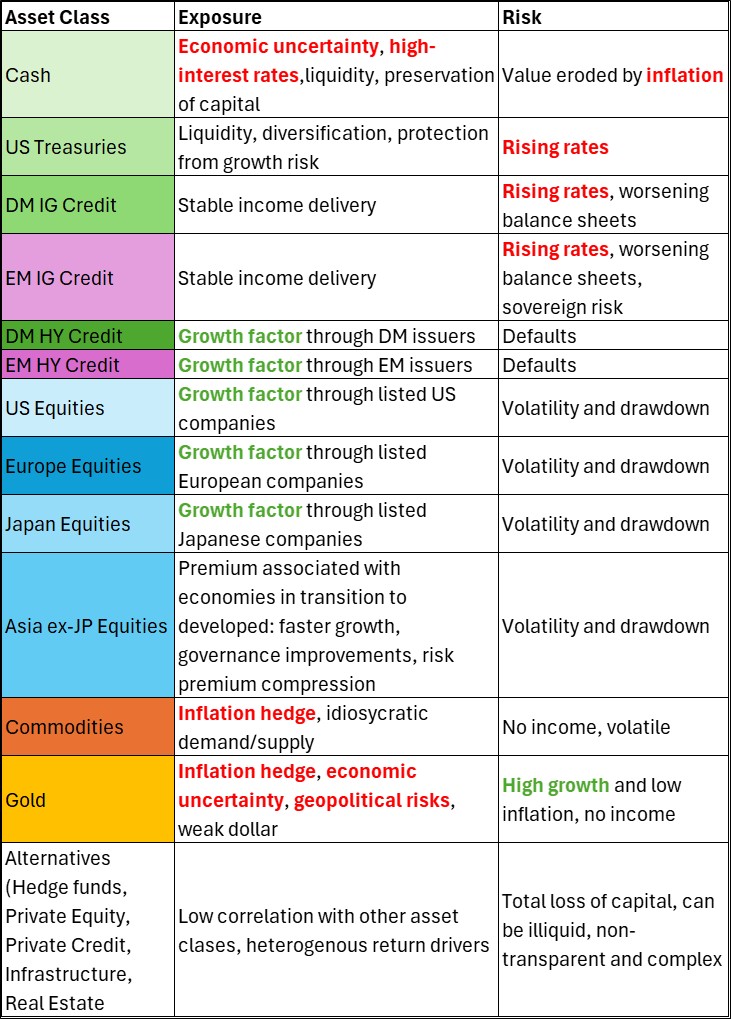
Note: Driver marked in green are supportive of discounted cashflows, while red reflects risks of worsening
Source: Bank of Singapore.
Commodities, such as copper and oil, are often driven by supply-demand dynamics and can act as a hedge against inflation, especially during high growth periods. Gold can be an even more consistent hedge against inflation, as well as against USD depreciation and acute geopolitical risk.
Alternatives – which cover a broad range including hedge funds, private markets, infrastructure and real estate – are influenced by growth factors, but also by manager selection, deal and vintage risk, reflecting the heterogeneity of projects and investments in each Alternatives vertical.
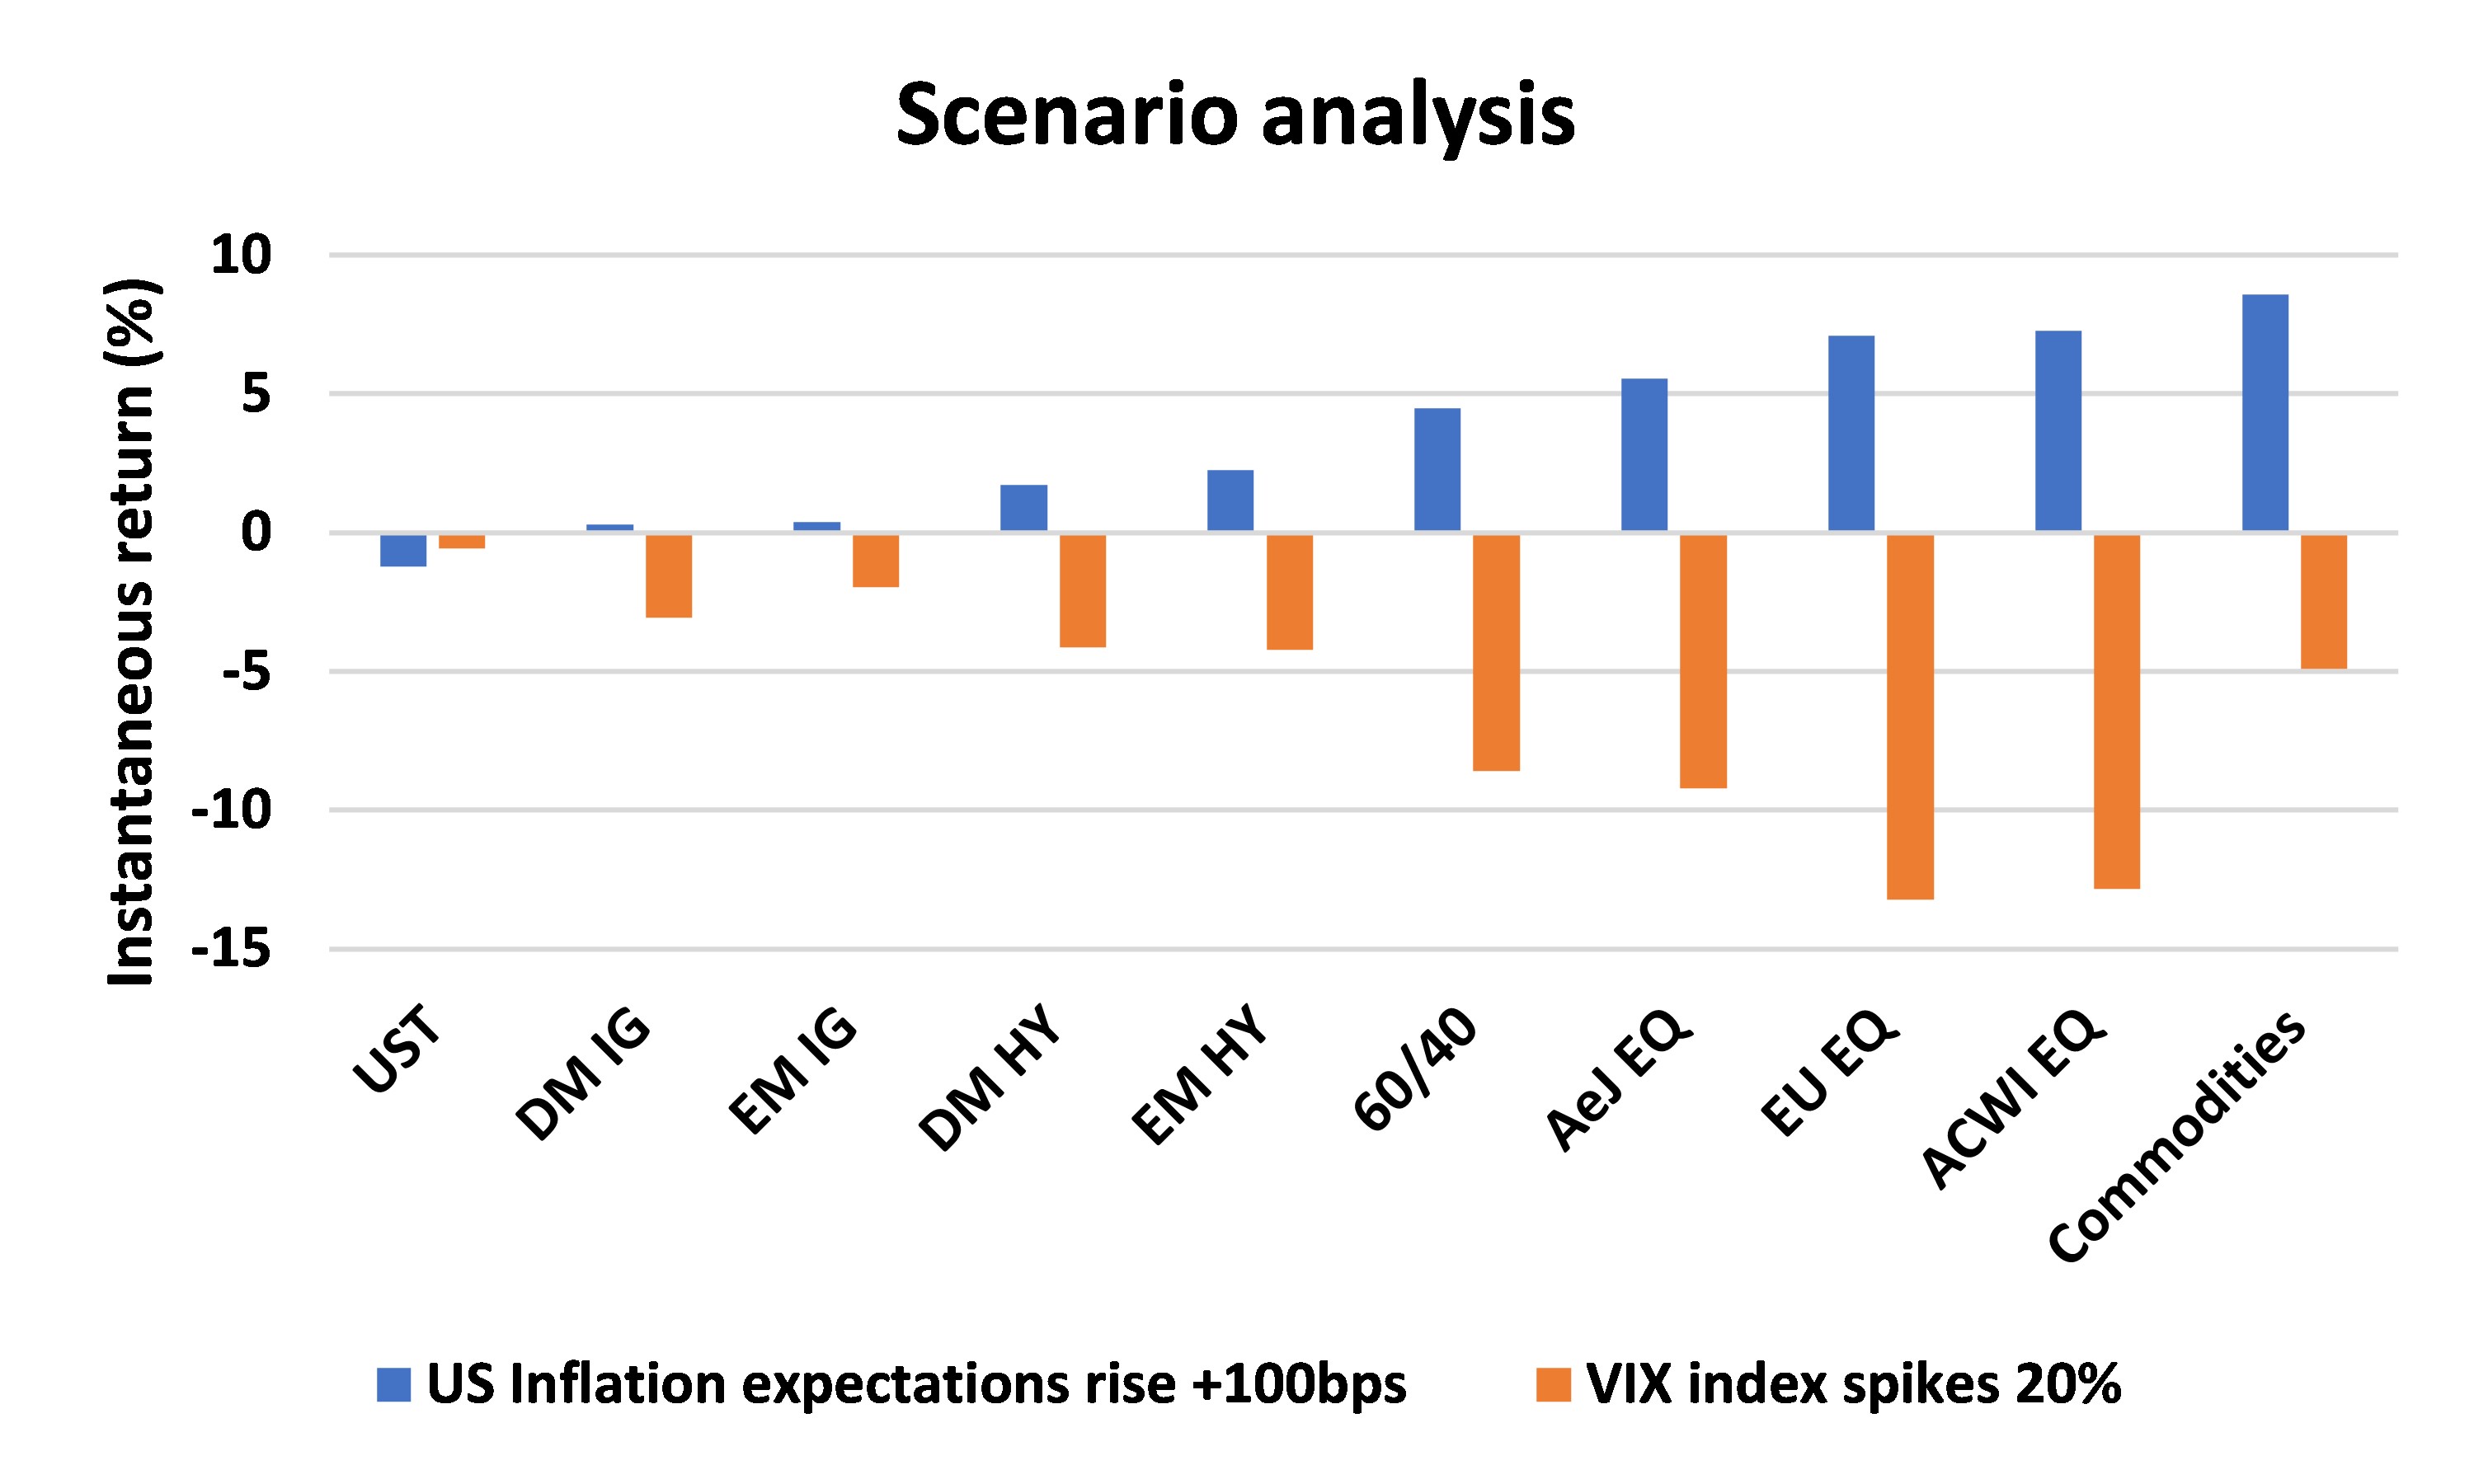
Scenario analysis using a factor-based model of return and risk attribution can help to illustrate how the same catalyst exerts a differentiated impact across asset classes. The following chart illustrates the hypothetical returns associated with two distinct and probable shocks: a rise in market implied inflation expectations (measured as a 100bps increase in the spread between 2Y USTs and 2Y Treasury Inflation Protected Securities (TIPS); the blue bars), and a spike in market risk (represented as a 10% increase in the VIX index; orange bars).
Exhibit 10: Scenario analysis: Possible impact on select asset classes from rising US inflation expectations or a spike in US equity volatility
Source: Bank of Singapore, using Blackrock Aladdin.
Understanding distinct drivers and risks helps investors strategically allocate assets to balance growth potential and mitigate risks across varying market conditions. Using history as a guide to potential relative performance across asset classes can give direction on which can benefit in prospective macro regimes. The following exhibit arrays asset class performance within four macro regimes that have prevailed over the last 20 years for which we have a full complement of data. To facilitate comparison, asset classes are tagged to a unique colour.
The ranking of asset class performance varies significantly across the different macro regimes and the full sample. It is worth highlighting four observations.
Exhibit 11: Asset class performance in different macro regimes, ranked in descending order (monthly YoY returns, 2003 –2024)
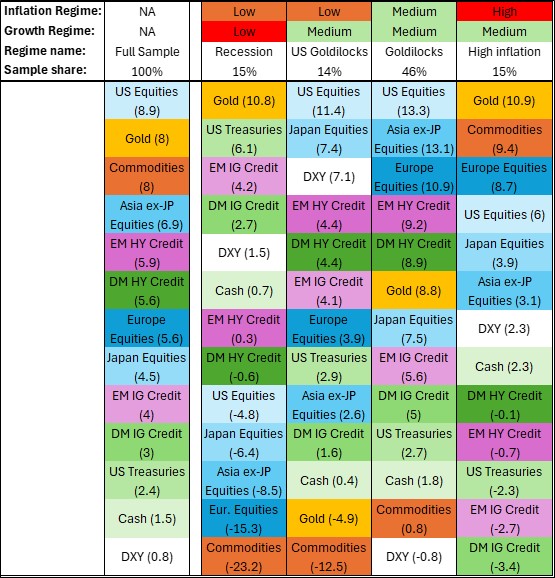
Note: Assets are arrayed in descending performance within the given macro regime (average returns in percent are given in parenthesis). Monthly YoY returns from 2003-2024 (longest period available across all asset classes). Only the 4 macro regimes (of 9) which reach our minimum 4% sample size are shown.
Source: Bank of Singapore.
Given the implementation of sizable tariffs, probabilities of both inflation and growth slowdown/recession have risen. Hence diversifying to include non-USD return streams, as well as including a mix of high-quality bonds and gold to hedge to the growthier parts of portfolios, make sense.
Other strategies for managing through the fog
Beyond maintaining a long-term mind-set, leaning into bonds as a ballast, and keeping a thoughtfully diversified set of exposures, it is worth reiterating some additional useful investment management strategies:
Closing thoughts
In these days marked by radical uncertainty and unpredictable macroeconomic shifts, investors must fortify their portfolios through disciplined, strategic approaches grounded in fundamental investment principles. Three core asset allocation values are key to staying on course:
As history shows, time in the market consistently outperforms attempts at timing the market. Sticking to a structured, deliberate investment strategy – one that acknowledges the unknown and unknowable – is the most reliable path to sustained growth and resilience
[1] First coined by the economist Richard Zeckhauser in his essay “Investing in the Unknown and Unknowable” in 2006, environments are considered “Unknown and Unknowable” when both the relevant factors and their probabilities are unclear or even unidentified. It’s not just about unmeasured risks, it’s about the potential for the unexpected to emerge from areas previously thought irrelevant or safe.
Important information
This product may only be offered: (i) in Hong Kong, to qualified Private Banking Customers and Professional Investors (as defined under the Securities and Futures Ordinance); and (ii) in Singapore, to Accredited Investors (as defined under the Securities and Futures Act) and (iii) in the Dubai International Financial Center to Professional Clients (as defined under the Dubai Financial Services Authority rules) only. No other person should act on the contents of this document.This product may involve derivatives. Do NOT invest in it unless you fully understand and are willing to assume the risks associated with it. If you have any doubt, you should seek independent professional financial, tax and/or legal advice as you deem necessary.
Please carefully read and make sure that you understand all Risk Disclosures, Selling Restrictions, and Disclaimers. This document must be read together with the relevant Prospectus & Offering Documents &/or Key Fact Statement.
Disclaimer
The Bank, its Affiliates and their respective employees are not in the business of providing, and do not provide, tax, accounting or legal advice to any clients. The material contained herein is prepared for informational purposes and is not intended or written to be used, and cannot be used or relied upon for tax, accounting or legal advice. Any such client is responsible for consulting his/her own independent advisor as to the tax, accounting and legal consequences associated with his/her investments/transactions based on the client’s particular circumstances.
This document and other related documents have not been reviewed by, registered or lodged as a prospectus, information memorandum or profile statement with the Monetary Authority of Singapore nor any regulator in Hong Kong or elsewhere.
This document may not be published, circulated, reproduced or distributed in whole or in part to any other person without the Bank’s prior written consent. This document is not intended for distribution to, publication or use by any person in any jurisdiction outside Singapore, Hong Kong, or such other jurisdiction as the Bank may determine in its absolute discretion, where such distribution, publication or use would be contrary to applicable law or would subject the Bank and its related corporations, connected persons, associated persons and/or affiliates (collectively, “Affiliates”) to any registration, licensing or other requirements within such jurisdiction.